As of the first quarter 2013,
Ken Fisher
held 474 stocks valued at over $37.628 billion. The following
companies represent his top increases and decreases in holdings.
1. BP PLC ( BP )
Fisher made the largest increase in BP during the last quarter. He increased his holdings by 28478.2%, adding a total of 1,463,782 shares. He purchased these shares at an average price of $42.49 per share. Since this purchase the price per share has increased 3% from the average purchase price.
Fisher holds on to 1,463,782 shares of BP, representing 0.17% of his total portfolio.
Click here for the Holding History of other gurus
BP provides fuel for transportation, energy for heat and light, lubricants to keep engines moving and the petrochemical products used to make everyday items like plastic bottles. It operates through two business segments: Exploration and Production as well as Refining and Marketing.
BP has a market cap of $139.18 billion; its shares were traded at around $43.59 with a P/E ratio of 6.20 and P/S ratio of 0.40. The dividend yield of BP stocks is 4.80%.
 2.
Citigroup (
C
)
2.
Citigroup (
C
)
Fisher increased his holdings in Citigroup 5025.84% during the first quarter. He bought 372,465 shares at an average price of $43.48 per share. Since this purchase the price per share has increased 20.1% from the average purchase price. Fisher now owns 379,876 shares of Citigroup, making up 0.045% of his total portfolio.
Click here for the Holding History of other gurus
Citigroup is a global financial services holding company, whose businesses provide consumers, corporations, governments and institutions with a range of financial products and services, including consumer banking, credit cards, corporate and investment banking, securities brokerage and wealth management. Citigroup has more than 200 million customer accounts and does business in more than 160 countries.
Citigroup has a market cap of $158.47 billion; its shares were traded at around $52.07 with a P/E ratio of 18.40 and P/S ratio of 2.20. The dividend yield of Citigroup stocks is 0.10%.

3. Bank of America ( BAC )
Fisher bought 1,398,080 shares of Bank of America during the first quarter. This represents a 4846.54% increase in his holdings on the company. The shares traded at an average $11.84 per share. Since Fisher's buy, the price per share has increased 13.9% from the average purchase price.
Fisher now holds on to 1,426,927 shares of Bank of America, representing 0.046% of his total portfolio.
Click here for the Holding History of other gurus
Bank of America, through its banking and various non-banking subsidiaries throughout the U.S, provides a diversified range of banking and non-banking financial services and products through six business segments: Deposits, Card Services, Consumer Real Estate Services, Global Commercial Banking, Global Banking & Markets and Investment Management.
Bank of America has a market cap of $144.99 billion; its shares were traded at around $13.48 with a P/E ratio of 41.70 and a P/S ratio of 1.70. The dividend yield of Bank of America stocks is 0.30%.
 4.
Petroleo Brasileiro SA Petrobras (
PBR
)
4.
Petroleo Brasileiro SA Petrobras (
PBR
)
During the first quarter, Fisher dumped 12,535,029 shares of Petroleo Brasileiro stock, representing a -98.71% decrease in his holdings on the company. He sold these shares for an average price of $17.52 per share. Since his sell the price per share has increased 2.3% from his average sell price.
Fisher still holds 163,261 shares, representing 0.0072% of his total portfolio.
Click here for the Holding History of other gurus
Petroleo Brasileiro was formed to conduct the Brazilian government's hydrocarbon activities. It began operations in 1954 and for approximately forty years carried out crude oil and natural gas production and refining activities in Brazil on behalf of the government. It is an integrated oil and gas company in Brazil and in Latin America who is the supplier of crude oil and oil products.
Petroleo Brasileiro has a market cap of $116.11 billion; its shares were traded at around $17.89 with a P/E ratio of 12.20 and a P/S ratio of 0.80. The company had an annual average earnings growth of 10.5% over the past ten years.
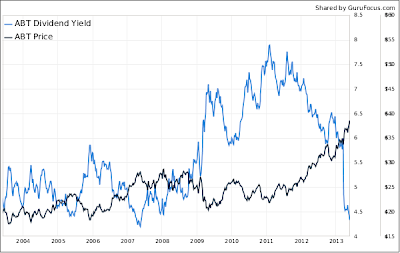
5. Abbott Laboratories ( ABT )
Fisher decreased his holdings in Abbott Laboratories by -95.16% in the most recent quarter. He sold 226,811 shares for an average price of $33.88 per share. Since his sell the price per share has increased 11.3%.
Ken Fisher still holds 11,528 shares of Abbott Laboratories, representing a very small 0.0011% of his total portfolio.
Click here for the Holding History of other gurus
Abbott Laboratories' main business is the discovery, development, manufacture and sale of a broad and diversified line of health care products. Abbott has five reportable revenue segments: Proprietary Pharmaceutical Products, Established Pharmaceutical Products, Diagnostic Products, Nutritional Products and Vascular Products.
Abbott Laboratories has a market cap of $58.33 billion; its shares were traded at around $37.70 with a P/E ratio of 11.30 and P/S ratio of 1.50. The company had an annual average earnings growth of 10.3% over the past ten years. GuruFocus rated Abbott Laboratories the business predictability rank of 3.5-stars. The dividend of Abbott Laboratories stocks is 3.50%.
 Source: GuruFocus
1. BP PLC ( BP )
Fisher made the largest increase in BP during the last quarter. He increased his holdings by 28478.2%, adding a total of 1,463,782 shares. He purchased these shares at an average price of $42.49 per share. Since this purchase the price per share has increased 3% from the average purchase price.
Fisher holds on to 1,463,782 shares of BP, representing 0.17% of his total portfolio.
Click here for the Holding History of other gurus
BP provides fuel for transportation, energy for heat and light, lubricants to keep engines moving and the petrochemical products used to make everyday items like plastic bottles. It operates through two business segments: Exploration and Production as well as Refining and Marketing.
BP has a market cap of $139.18 billion; its shares were traded at around $43.59 with a P/E ratio of 6.20 and P/S ratio of 0.40. The dividend yield of BP stocks is 4.80%.

Fisher increased his holdings in Citigroup 5025.84% during the first quarter. He bought 372,465 shares at an average price of $43.48 per share. Since this purchase the price per share has increased 20.1% from the average purchase price. Fisher now owns 379,876 shares of Citigroup, making up 0.045% of his total portfolio.
Click here for the Holding History of other gurus
Citigroup is a global financial services holding company, whose businesses provide consumers, corporations, governments and institutions with a range of financial products and services, including consumer banking, credit cards, corporate and investment banking, securities brokerage and wealth management. Citigroup has more than 200 million customer accounts and does business in more than 160 countries.
Citigroup has a market cap of $158.47 billion; its shares were traded at around $52.07 with a P/E ratio of 18.40 and P/S ratio of 2.20. The dividend yield of Citigroup stocks is 0.10%.

3. Bank of America ( BAC )
Fisher bought 1,398,080 shares of Bank of America during the first quarter. This represents a 4846.54% increase in his holdings on the company. The shares traded at an average $11.84 per share. Since Fisher's buy, the price per share has increased 13.9% from the average purchase price.
Fisher now holds on to 1,426,927 shares of Bank of America, representing 0.046% of his total portfolio.
Click here for the Holding History of other gurus
Bank of America, through its banking and various non-banking subsidiaries throughout the U.S, provides a diversified range of banking and non-banking financial services and products through six business segments: Deposits, Card Services, Consumer Real Estate Services, Global Commercial Banking, Global Banking & Markets and Investment Management.
Bank of America has a market cap of $144.99 billion; its shares were traded at around $13.48 with a P/E ratio of 41.70 and a P/S ratio of 1.70. The dividend yield of Bank of America stocks is 0.30%.

During the first quarter, Fisher dumped 12,535,029 shares of Petroleo Brasileiro stock, representing a -98.71% decrease in his holdings on the company. He sold these shares for an average price of $17.52 per share. Since his sell the price per share has increased 2.3% from his average sell price.
Fisher still holds 163,261 shares, representing 0.0072% of his total portfolio.
Click here for the Holding History of other gurus
Petroleo Brasileiro was formed to conduct the Brazilian government's hydrocarbon activities. It began operations in 1954 and for approximately forty years carried out crude oil and natural gas production and refining activities in Brazil on behalf of the government. It is an integrated oil and gas company in Brazil and in Latin America who is the supplier of crude oil and oil products.
Petroleo Brasileiro has a market cap of $116.11 billion; its shares were traded at around $17.89 with a P/E ratio of 12.20 and a P/S ratio of 0.80. The company had an annual average earnings growth of 10.5% over the past ten years.
5. Abbott Laboratories ( ABT )
Fisher decreased his holdings in Abbott Laboratories by -95.16% in the most recent quarter. He sold 226,811 shares for an average price of $33.88 per share. Since his sell the price per share has increased 11.3%.
Ken Fisher still holds 11,528 shares of Abbott Laboratories, representing a very small 0.0011% of his total portfolio.
Click here for the Holding History of other gurus
Abbott Laboratories' main business is the discovery, development, manufacture and sale of a broad and diversified line of health care products. Abbott has five reportable revenue segments: Proprietary Pharmaceutical Products, Established Pharmaceutical Products, Diagnostic Products, Nutritional Products and Vascular Products.
Abbott Laboratories has a market cap of $58.33 billion; its shares were traded at around $37.70 with a P/E ratio of 11.30 and P/S ratio of 1.50. The company had an annual average earnings growth of 10.3% over the past ten years. GuruFocus rated Abbott Laboratories the business predictability rank of 3.5-stars. The dividend of Abbott Laboratories stocks is 3.50%.


